The last post took apart a single citation graph: mine. Why Citations Drive AI Visibility sorted 2,310 citations across 581 domains and read what each one meant. The question one graph can't answer: is it shaped that way because I do SEO in New Jersey, or because that's just how these graphs are built?
So I pulled the same graph for eight sites I track across six industries, from local service businesses to enterprise software: roughly 25,000 citations across about 3,000 source domains. To be clear, this isn't the academic citation graph that maps which papers cite which; it's the web of sources an AI platform leans on when it answers questions in your category. Everything below is anonymized in aggregate; the only site I will name is my own.
The finding: the shape is the same in all of them. What changes by industry isn't the shape. It's which domains fill the slots.
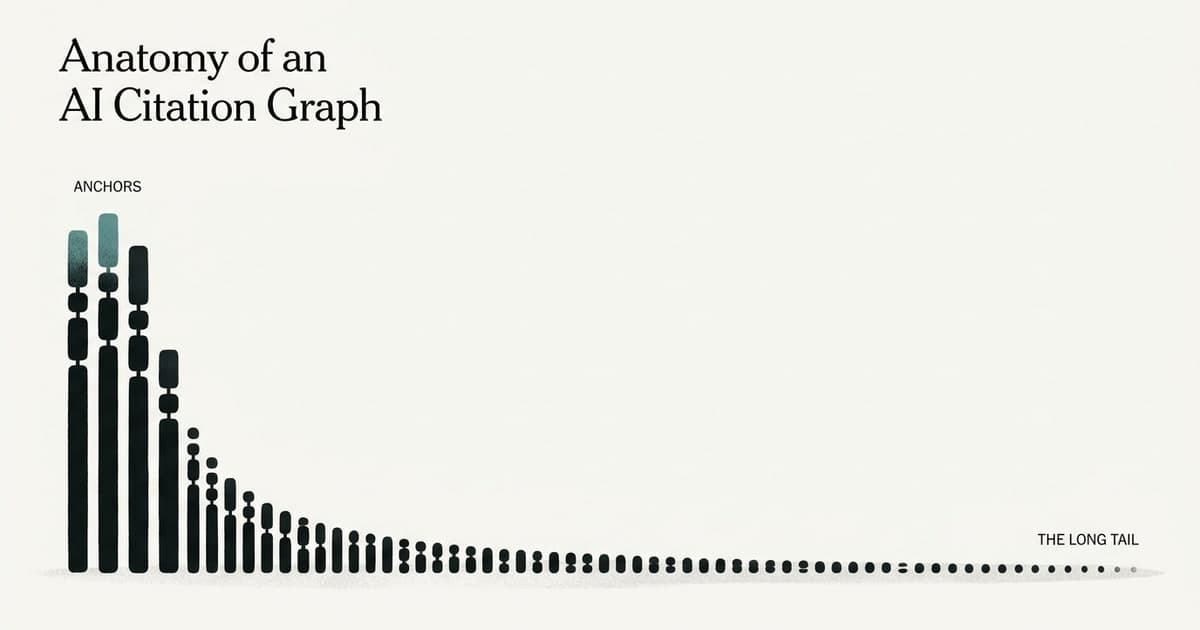
Every citation graph I pulled has the same skeleton. The flesh on it is different every time.
Does every AI citation graph look the same?
Take the top ten domains in each graph, the ten sources a platform leans on most for that site's category. Across all eight sites, the top ten accounted for between 19% and 43% of every citation. No site was a runaway where a few sources owned everything; none was perfectly flat. A modest head, every time.
Then the tail. In every graph with enough data to trust, almost exactly half the domains were cited just once: 46% to 50%, site after site. Not a short list of gatekeepers. A long, thin tail of sources the model reached for one time and never again.
Six industries, eight sites, one shape: a modest head and a heavy tail. My own graph from the last post sits right in the middle of that band, and at the time I assumed that was a fact about the New Jersey SEO market. It isn't. It's a fact about how AI citation graphs are built.
If a few sources controlled AI visibility, every graph would be top-heavy. Across six industries, not one of them was.
What do all citation graphs share?
Below the shape, the graphs barely overlap. Different industries pull completely different sources, which is what you would expect. But three domains showed up almost everywhere: Wikipedia in seven of the eight graphs, YouTube and Reddit in six of eight. Nothing else appeared in even half.
They are tiny by volume, around 3% of all citations combined. But their reach is the point. These are the sources a model trusts regardless of what you sell: reference, video, and forum. Everything below them in any given graph is category-specific. The universal trust core is small, shared, and almost impossible to place on purpose.
What kinds of sources fill a citation graph?
The shape is universal. The contents are not, and the contents are where the work is.
The model builds its answer about your market almost entirely out of pages that are not yours.
So the useful question is what all that third-party material is. The categories from the last post, now measured across the whole pool:
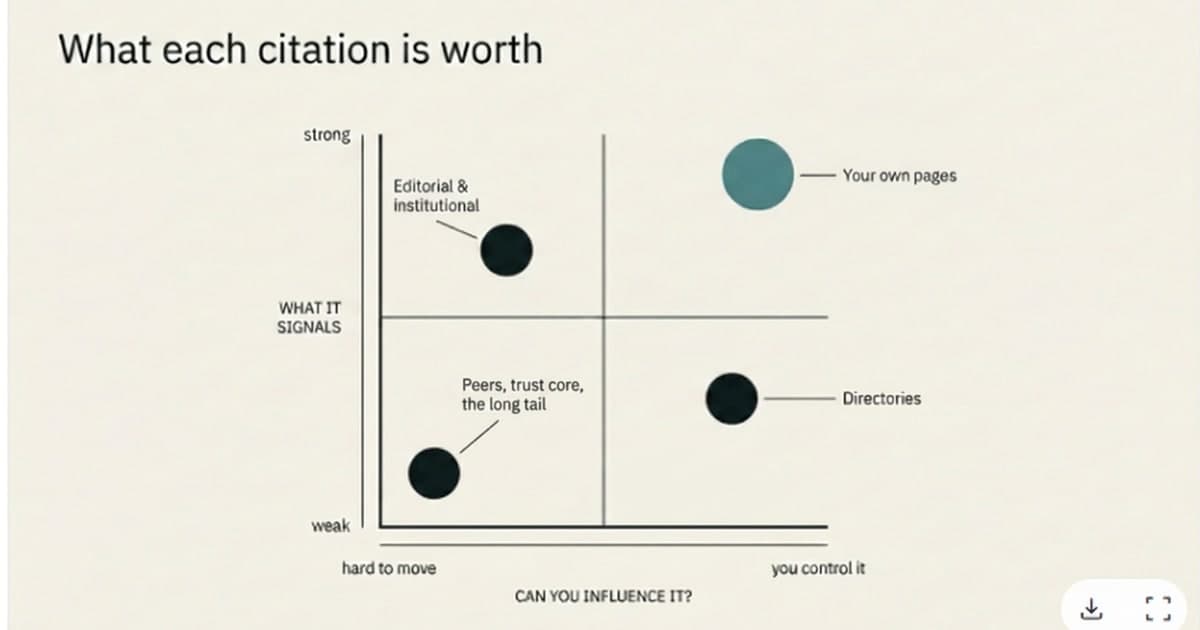
The universal trust core. Wikipedia, YouTube, Reddit: the sources a model trusts no matter what you sell. You rarely place these on purpose.
Directories and review aggregators. G2, Clutch, Capterra, DesignRush, and their kind. A consistent slice in every commercial graph. The argument they make is thin: "this brand is in the database." Presence, not position, because every competitor in the same directory carries the identical signal.
Government and institutional. Small overall, and sharply category-specific. When a category is regulated, the model reaches for its regulators and oversight bodies; for an unregulated category the bucket is nearly empty. The regulator defines the category, so the model cites it.
The wider field. By far the largest bucket: the broad web of industry and vendor sites, trade press, and analysts, including competitors the brand was not even tracking. This is where a citation graph actually lives, and it is mostly the long tail.
That's also where the composition shifts by industry, which is the whole "slots versus shape" point. A regulated industry fills the field with its regulators and trade press. A local-service category fills it with local directories and review sites. A technical-product category fills it with vendor pages and industry press. Same skeleton, different flesh.
Two things separate these categories: how strong a signal each one sends, and whether you can do anything about it. Sort by both and they fall into four corners.
One caveat I will keep honest: this pool leans heavily on a couple of large datasets, so treat the exact percentages as a pool-wide aggregate, not a precise constant for every site. The pattern is the signal; the decimals are not.
How do you read your own citation graph?
Run the harvest on one site and you can read it against everything above in four passes.
Head or tail. Is your top ten a modest 20% to 40%, or is it top-heavy? If it is top-heavy, check your questions first. You probably asked the model to compare brands, and you are reading a graph your prompts built.
Your own share. Expect it to be small. 2.7% was the pool average. Your own pages losing to third parties is the normal state, not a failure; the work is rarely on your own site.
Which slots are filled. Walk the categories. Editorial and institutional sources citing you is the read most brands want and the hardest to earn. Directories are a floor. The wide tail is reach. The empty categories are the interesting ones.
The gaps. The category that should be in your graph and is not is your opportunity, not your weakness. That is the bridge to the next post.
The shape tells you the game is winnable in roughly the same way for everyone. The contents tell you where to play.
FAQ
In shape, yes. Across eight sites in six industries, the top ten sources accounted for 19% to 43% of citations and roughly half of all source domains were cited exactly once, every time. The shape is a modest head over a long tail. What differs is the contents: which specific domains fill the slots changes completely by industry.
Every citation graph I pulled has the same anatomy: a small shared trust core, a modest head of category sources, and a long tail that is half single citations. That part is universal, and it's not the part you can change. What's not universal is which domains fill your slots, and that's the only part you can move.
The next post in this series, how to get cited by AI, is about exactly that: turning the shape into a short list of moves, which sources to earn into and which gaps to close.
If your AI search citation graph is a question mark, book a free intro call. I'll show you what I see when I run the harvest on your site, and whether the engagement makes sense.
No pitch, no pressure.

WRITTEN BY
SEO & Answer Engine Optimization Specialist
I'm an independent SEO and answer engine optimization specialist based in Morris County. I help small businesses rank in Google, and now in ChatGPT, Perplexity, and Google's AI overviews. No agency overhead. No junior account managers. Just focused, expert work.